

Oct 2, 2024 Story by: Editor
The nomination of Howard University alumna Kamala Harris for president has sparked renewed interest in historically Black colleges and universities (HBCUs) across the United States.
HBCUs have been around for more than 150 years and continue to play a vital role in the U.S. higher education system. As of fall 2022, the most recent period with available data, 99 HBCUs were in operation nationwide, collectively enrolling just under 290,000 students, according to the National Center for Education Statistics.
What are HBCUs?
HBCUs are defined by Congress as accredited higher education institutions founded before 1964 with the primary goal of educating Black students. However, not all students attending HBCUs today are Black.
Before the Civil War, higher education opportunities for Black Americans were nearly nonexistent. While a few HBCUs were established prior to the Civil War, the majority were founded between 1867 and 1900 to provide educational opportunities for Black Americans, including formerly enslaved individuals.
Some HBCUs were also created in response to the Second Morrill Act of 1890, which required states to either admit Black Americans to existing institutions or fund new schools that would serve them. These institutions, along with others established under similar legislation, are known as “land-grant institutions.”
HBCUs can be either public or private institutions. Of the 99 HBCUs in 2022, 50 were public, and 49 were private. Most HBCUs are four-year institutions, primarily awarding bachelor’s degrees.
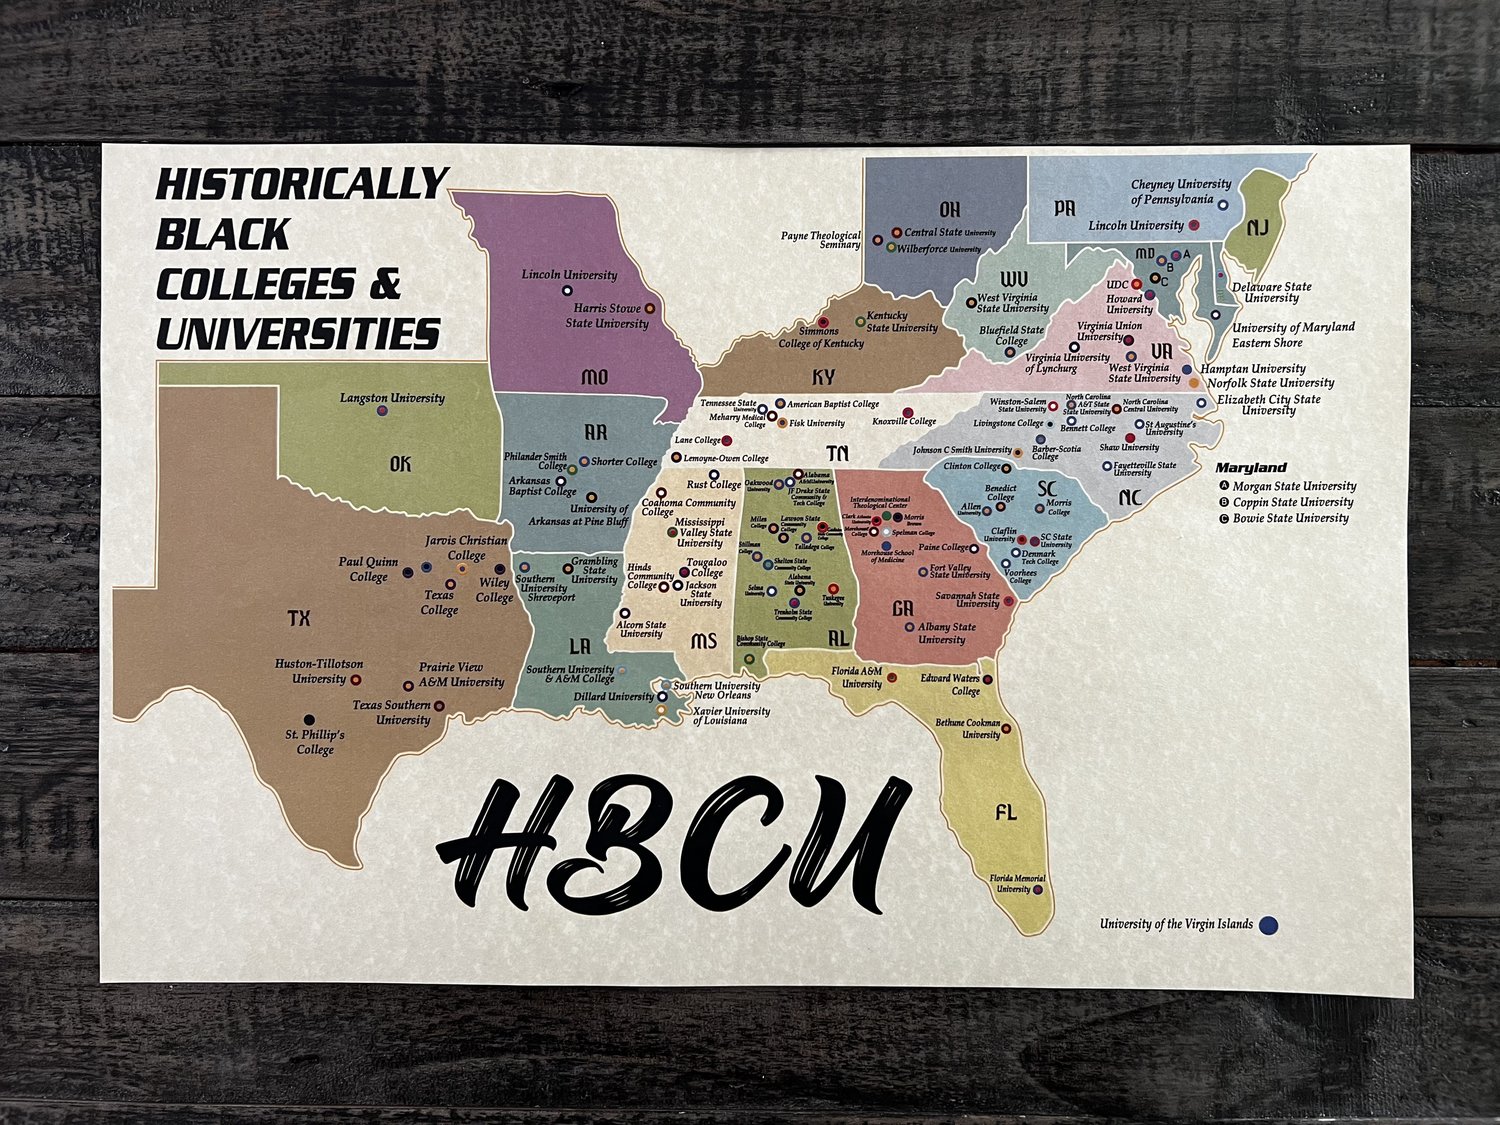
Where are HBCUs located?
The majority of HBCUs are located in the South. In 2022, Alabama had the most, with 13, followed by North Carolina with 10. Other states with a significant number of HBCUs include Georgia, Texas, South Carolina, Louisiana, Mississippi, and Tennessee. Some HBCUs are found as far north as Pennsylvania (Cheyney University of Pennsylvania, Lincoln University) and even outside the continental U.S. (University of the Virgin Islands).
How has enrollment at HBCUs changed over time?
Between 1976 and 2010, HBCU enrollment grew but has slightly declined since then. In 1976, over 222,000 students of various racial and ethnic backgrounds were enrolled at HBCUs. That number peaked at more than 326,000 in 2010. Despite the slight decrease, nearly 290,000 students were enrolled in HBCUs in 2022, marking a 30% increase since 1976.
This enrollment pattern mirrors trends at other U.S. colleges and universities. Total U.S. college enrollment rose from 11 million students in 1976 to over 21 million in 2010 before declining to about 18.6 million in 2022, a 69% increase from 1976.
HBCUs have also experienced changes in the racial composition of their student bodies. While Black student enrollment at HBCUs increased by 15% between 1976 and 2022, students of other racial or ethnic backgrounds attending HBCUs increased by 117%. As a result, the share of Black students at HBCUs decreased from 85% to 76%.
Meanwhile, the proportion of Black students enrolled at all U.S. colleges and universities increased by 125% during the same period, compared to a 63% rise among students of other races or ethnicities. By 2022, Black students made up 13% of all college students, in line with their representation in the U.S. population.
These shifts mean that fewer Black students are attending HBCUs. In 1976, 18% of all Black college students were enrolled at HBCUs, but by 2022, that number dropped to 9%. However, HBCUs still awarded 16% of the bachelor’s degrees earned by Black students during the 2021-22 academic year.
These figures precede the U.S. Supreme Court’s 2023 decision barring colleges from considering race in admissions. The ruling may impact future enrollment patterns.
How does enrollment vary among HBCUs?
HBCUs vary significantly in size. In 2022, the median enrollment at HBCUs was 1,840 students. However, three schools—North Carolina A&T in Greensboro, Howard University in Washington, D.C. (Harris’ alma mater), and Saint Philip’s College in San Antonio, Texas—each enrolled more than 12,000 students. At the other end of the spectrum, 10 HBCUs had fewer than 500 students.
Most HBCUs continue to enroll a majority of Black students. In 2022, 65 of the 99 HBCUs had student bodies where more than 80% of the students were Black. However, some HBCUs have seen changes in their demographics. At eight HBCUs, more than half of the student population was not Black, including Saint Philip’s College and West Virginia State University, where only 9% of students were Black. (Saint Philip’s is also classified as a Hispanic-serving institution, and the majority of its students in 2022 were Hispanic. West Virginia State primarily serves White students.)
For some HBCUs, low enrollment numbers or an increase in non-Black students may reflect broader challenges in higher education. Since 2016, at least 120 colleges and universities across the U.S. have closed, merged, or announced plans to do so. This issue could become more pronounced as the number of high school graduates is expected to peak in 2025 and then decline—a trend some call the “enrollment cliff.” As a result, some HBCUs are expanding their recruitment efforts to include non-Black students.
What does government funding look like at HBCUs?
HBCUs have historically been underfunded compared to other colleges and universities. A 2023 analysis by the U.S. Departments of Education and Agriculture found that historically Black land-grant institutions received approximately $12.6 billion less in state funding between 1987 and 2020 compared to other land-grant schools. Additionally, a 2019 report from the American Council on Education revealed that private HBCUs experienced the steepest declines in federal funding per student between 2003 and 2015. Source: PewResearch


